During the last few days I took a small detour from the land of the JIT, to the land of the profiler.
There is of course the DAS_ENABLE_PROFILER define which can give some decent idea of hot spots,
but it was brought to my attention that we need to go deeper.
My first thought was to extend the built-in profiler capabilities with the timing information,
add exporting capabilities, and be done.
Built-in profiler has relatively low overhead and is already half the way there.
I might still do it, but there are downsides.
First and foremost its a build configuration option which requires separate build configuration or separate executable.
Second disadvantage is that its implemented in C++. Long term direction is to rewrite as much of daScript in daScript as possible.
Binding additional optional interfaces is not exactly conducive for the goal.
Lastly we have perfectly good instrumentation which is already bound and used by the debugger. Expanding on it would only be natural.
At the end of the day results can be seen in the profiler.das and profilter_boost.das parts of daslib.
Instrumentation starts with creating debug agent in form of DapiDebugAgent.
Its an event listener, with user defined behaviors for the specific events. For the profiler we will only be interested in the following ones
def abstract onInstall ( agent:DebugAgent? ) : void
def abstract onUninstall ( agent:DebugAgent? ) : void
def abstract onCreateContext ( var ctx:Context ) : void
def abstract onDestroyContext ( var ctx:Context ) : void
def abstract onInstrumentFunction ( var ctx:Context; fn:SimFunction?; entering:bool; userData:uint64 ) : void
onInstall is called when the debug agent is installed. When fork_debug_agent_context is called
- a clone of the current context is created
- an argument function address is used to call an agent creation function
- in its turn it creates an instance of a ‘DapiDebugAgent’ and registers it with
install_new_debug_agent onInstallis called on newly created debug agent, once is registered
There is a lock on the global debug agent API so that no additional locking action is required on the implementation side.
The profiler needs to be installed during the compilation time, so macro initialization is exactly the spot to put it.[_macro] annotation makes it so that the function is invoked during the macro module initialization (as well as marking module to be a macro module).
We call is_compiling_macros_in_module("profiler") to make sure it only happens once and at the right time.
Here is what happens during the initialization
- profiler settings are collected from the command line arguments
- initial reference time tick is collected to mark the application starting point
- if profiler log is specified, the appropriate log file is created, and headers are written
onUninstall is called when the debug agent is uninstalled. That happens during the daScript environment shutdown.
Its only used to close the log file.
onCreateContext is called when the new daScript context is created or cloned. This is where the instrumentation comes in handy.
Calling instrument_all_functions(ctx) ensures that all context functions will invoke onInstrumentFunction.
It is safe to call instrumentation multiple times, but checking if specific context code has already been instrumented saves performance.
Cloned contexts share code and jobs or thread are always cloned.ctx.getCodeAllocatorId returns unique ID of the context code, and thus can identify multiple instrumentations.
Obviously we don’t want instrumentation to happen for just any context. We are not interested in the macro contexts,
contexts which are used for the folding during the compilation, or contexts which are being debugged.
Luckily those have specific context flags in the ctx.category which we can verify.
onDestroyContext is called when the daScript context is destroyed, after the shutdown infrastructure.
What we do there is dump the log and the profiler output for the context, as well as manually delete the memory associated with storing the profile data.
This is where performance spikes will occur. Making that long log file takes time.
Once the logging is separated into its own API, I’m going to move the logger into a separate thread.
In the meantime logging is off by default, and requires --das-profiler-log-file command line argument.
onInstrumentFunction gets called on the instrumented contexts, every time a function is entered or leaved.SimFunction is provided to identify specific function.
Its possible to assign additional user data to the function, but we don’t need it for the profiler.
In this implementation I choose to collect entries, so that they can be later analyzed and written in the log.
struct PerfEvent
    fun : SimFunction?  // function call
    ts : int64          // delta time in nanoseconds from the application start
    entering : bool     // entering or leaving the function
This structure happens to correspond well with the Google Chrome Trace Event Format
Open Google Chrome, Press F12, go to performance section, load the log, enjoy the view 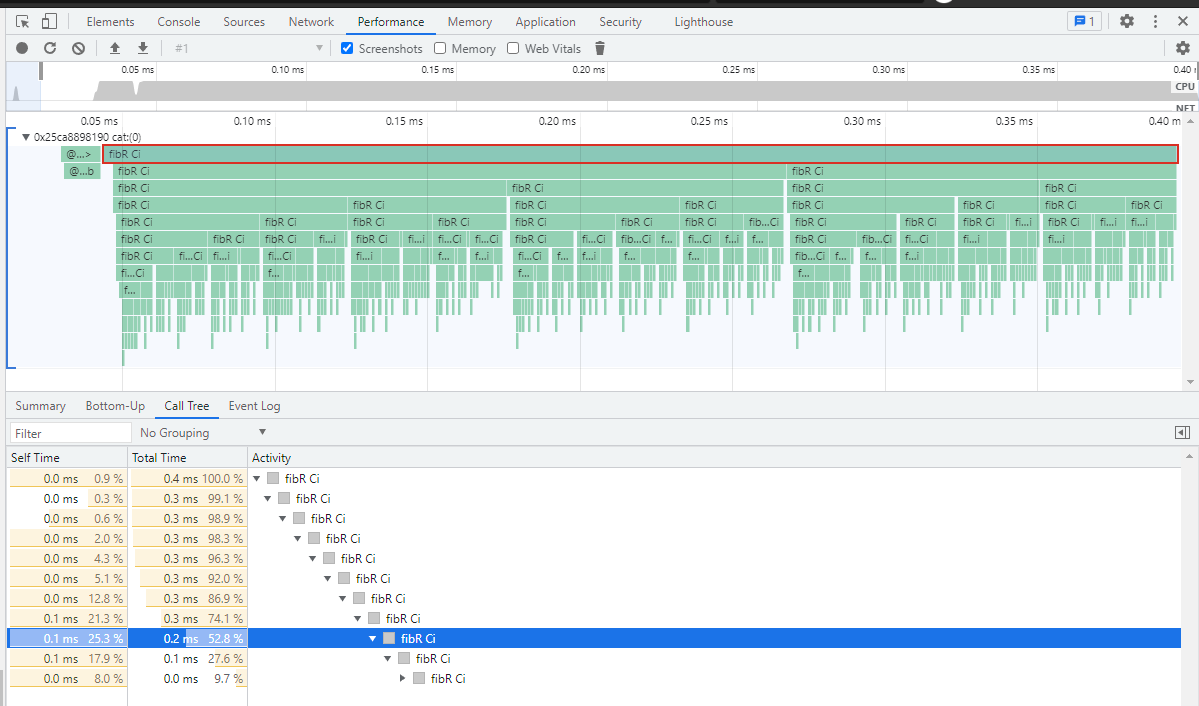
There are other tools which accept this format as well.
By default profiler outputs full call graph.
[I] wait_1_msec 1 1000300ns
[I] main 1 0ns
[I]   builtin`intptr C1<v>? 1 300ns
[I] fibR Ci 7 1714900ns
[I]   fibR Ci 27 1183900ns
[I]     fibR Ci 56 993100ns
[I]       fibR Ci 105 566400ns
[I]         fibR Ci 126 445400ns
[I]           fibR Ci 140 187400ns
[I]             fibR Ci 120 140500ns
[I]               fibR Ci 81 39500ns
[I]                 fibR Ci 55 30300ns
[I]                   fibR Ci 21 5000ns
[I]                     fibR Ci 12 5200ns
[I]                       fibR Ci 2 300ns
[I]                         fibR Ci 1 200ns
It includes call count as well as total time in nanoseconds for each call.
--das-profiler-manual is there so that recording does not happen once the application starts.
Instead application is expected to call enable_profiler(this_context()) and disable_profiler(this_context()) for the sections which we are interested in.
Overall this little project prooved a success. Implementation is extremely manageable and expandable.
Its a reasonable pattern to follow for the other instrumentation tools, which surely are things to come (did anyone say memory profiler?)
The only significant downside of this profiler implementation is its performance overhead.
Instrumentation on the macro level (adding prologue and epilogue to each function) would be more robust, as well as compatible with AOT and JIT.
At that point sampling based profiler would be in order, ideally integrated with some existing profiling infrastructure.
That however, is a topic for a whole separate exercise.